Digital Twins for Infrastructure: How Inspection Data Drives Predictive Maintenance
Infrastructure doesn’t deteriorate on a schedule. A bridge deck that looked acceptable in last year’s inspection report might be accelerating toward a threshold failure condition right now, driven by a winter that was harder than average, a traffic load that ran heavier than projected, or a drainage problem that went unnoticed until water found its way into a crack that was still within tolerance twelve months ago. Traditional inspection programs capture condition at a point in time. Digital twins capture condition as a continuous, evolving state – and that difference is what makes predictive maintenance possible in a way that periodic inspection alone never could be.
This article explains what a digital twin actually is in the context of infrastructure management, how inspection data feeds into one, and what the shift from reactive to predictive maintenance looks like in practice for road networks, bridges, airports, and other critical assets.
What a digital twin actually is
The term gets used loosely enough that it’s worth being precise. A digital twin is not a 3D model of an asset. It’s not a scan, an orthomosaic, or a GIS layer. Those are inputs. A digital twin is a dynamic virtual representation of a physical asset that is continuously updated with real-world data and capable of simulating future states based on current condition and projected load.
The distinction matters because a static model, however detailed, describes what an asset looked like at the moment it was captured. A digital twin describes what the asset is doing now, what it has done since the last update, and – through simulation and predictive modeling – what it is likely to do next. For infrastructure management, that forward-looking capability is the entire point. Knowing that a pavement section currently has a PCI of 74 is useful. Knowing that the same section is deteriorating at a rate that will carry it past your intervention threshold inside the next budget cycle, based on current condition trends and projected traffic load, is what drives a maintenance decision before the cost of intervention climbs.
How inspection data becomes a digital twin
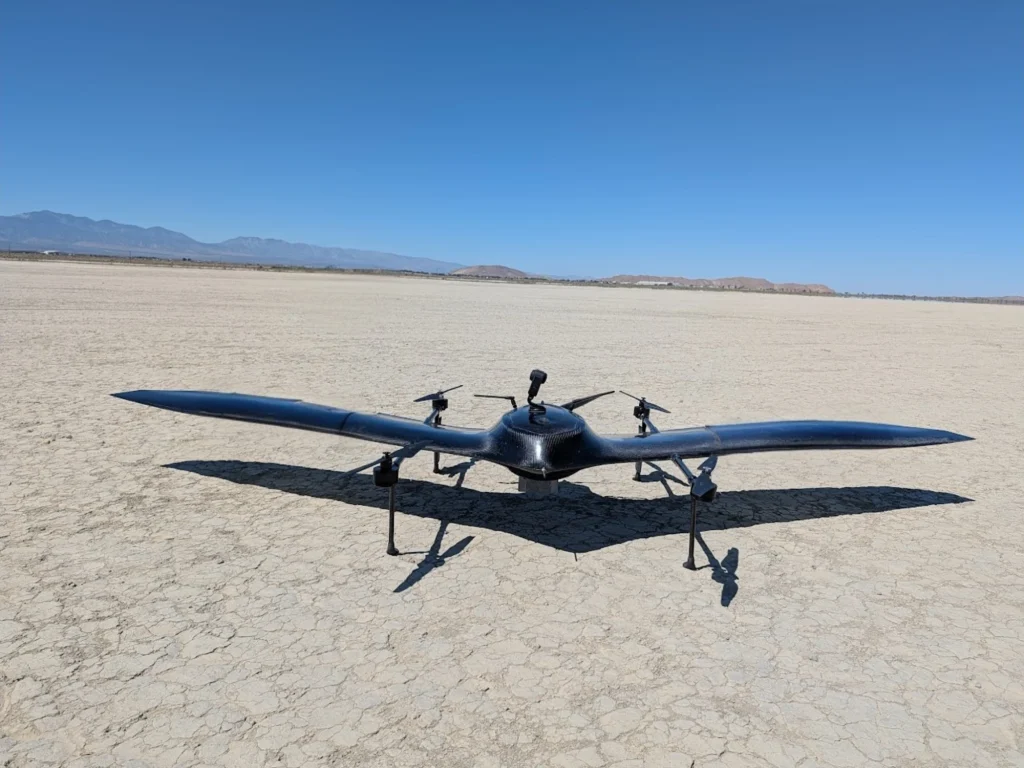
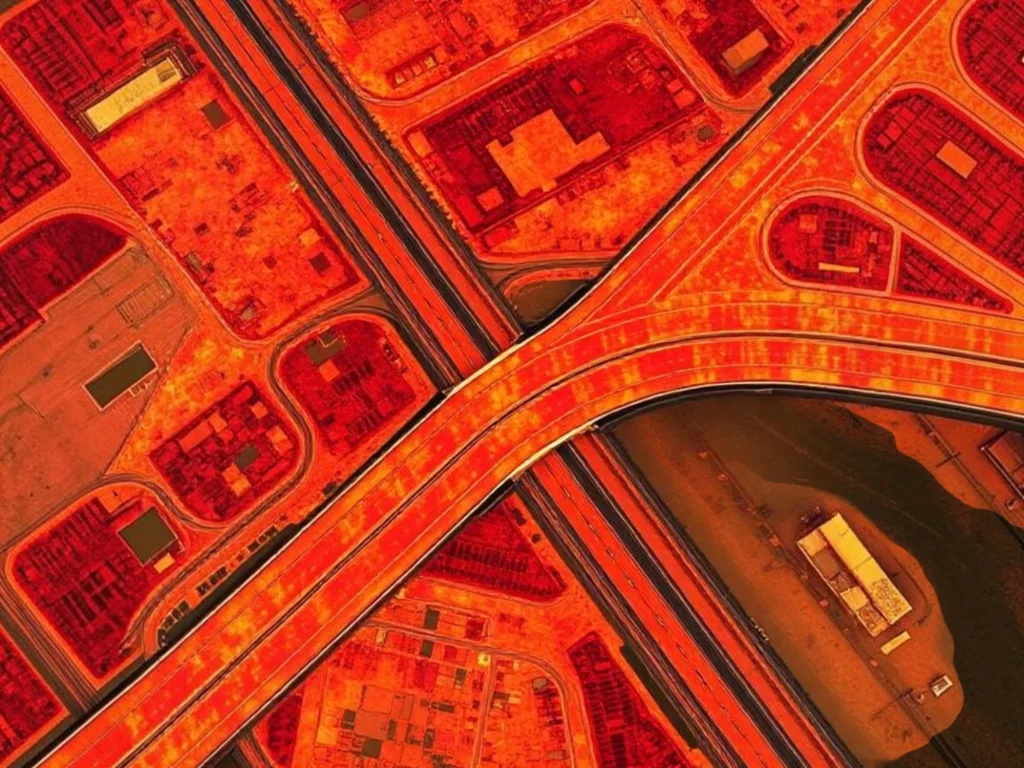
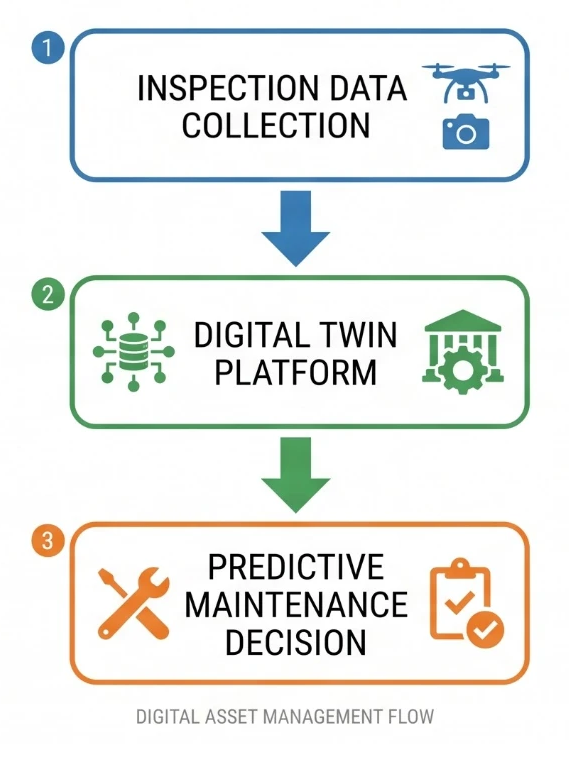
The data feeding a digital twin comes from multiple sources, and drone-based inspection is increasingly central to the collection layer. A drone survey of a road network or bridge structure produces georeferenced orthomosaics, point clouds, surface condition data, and defect maps that can be imported directly into a digital twin platform. Repeated at defined intervals, those surveys become the time-series dataset that allows the twin to track condition change rather than just condition state.
The workflow from inspection to twin involves several distinct steps. Raw drone imagery is processed into structured outputs, orthomosaics, digital surface models, crack maps, and condition indices, that are geolocated and tagged with the date of collection. Those outputs are imported into the twin platform and aligned with the asset’s existing geometric model. AI-powered analysis compares the new dataset against previous inspections, identifying where condition has changed, by how much, and at what rate. The twin’s predictive model uses that rate of change data, combined with material properties, load history, and environmental exposure, to project future condition and flag sections where deterioration is approaching maintenance thresholds.
The result is an asset management workflow that is continuous rather than episodic. Instead of a condition report that’s accurate on the day it’s produced and increasingly stale for the two or three years until the next inspection cycle, the digital twin holds a current picture of the asset that updates every time new inspection data arrives.
From condition monitoring to predictive maintenance
The operational shift that digital twins enable is from maintenance scheduling based on time intervals to maintenance scheduling based on actual condition trajectories. Those are fundamentally different approaches, and the difference has direct financial consequences.
Time-based maintenance schedules treat all assets in a category as equivalent. A road network managed on a five-year resurfacing cycle resurfaces sections that are still in good condition alongside sections that are genuinely deteriorating, and misses sections that are deteriorating faster than the cycle accounts for. Condition-based maintenance, driven by digital twin data, directs intervention to the sections that actually need it, at the point in their deterioration curve where intervention is most cost-effective.
The cost of intervention rises steeply as condition falls. Early repairs run 4 to 5 times cheaper than delayed rehabilitation (EIC deck), and Fadron’s own analysis puts planned maintenance near €12 per square meter against roughly €130 per square meter once reconstruction is the only option left. A section caught while the distress is still minor takes a preventive treatment. The same section left long enough needs rehabilitation, and left longer still, reconstruction. Digital twin-driven predictive maintenance is fundamentally an argument about timing: the right intervention, on the right section, at the right point in its deterioration curve, consistently produces better outcomes than any fixed-interval schedule can achieve.
What this looks like for different asset types
The application of digital twins to infrastructure management isn’t uniform across asset types, and the specific value it delivers differs depending on the asset’s complexity, inspection frequency, and failure consequences.
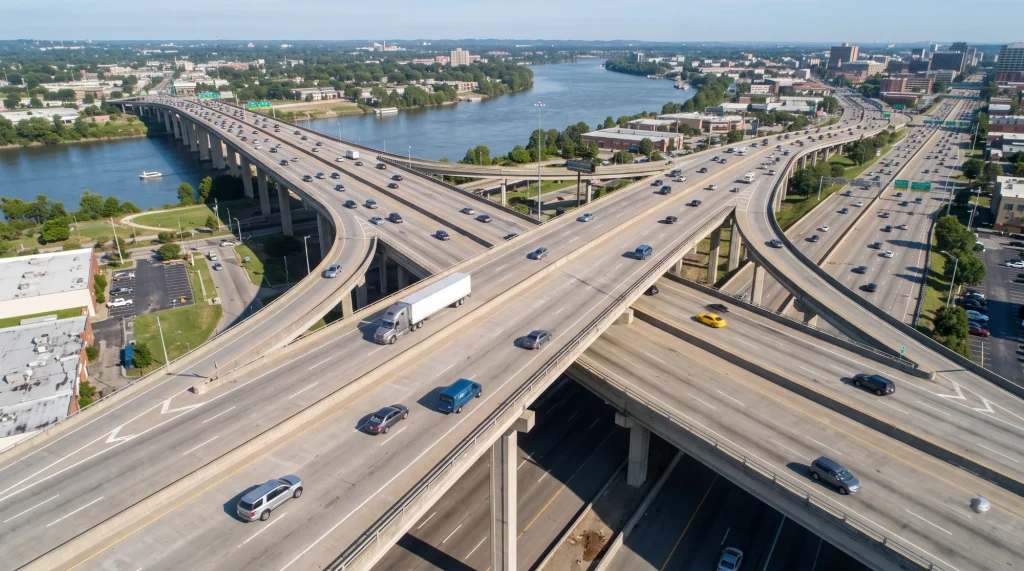
For road networks, the primary value is in pavement condition modeling across large, geographically distributed asset portfolios. A highway authority managing thousands of kilometers of road surface can’t optimize maintenance spend without knowing the condition trajectory of every section, not just the sections inspected most recently. A digital twin fed by regular drone pavement surveys provides that portfolio-wide picture, allowing budget allocation to be driven by projected condition at the point of intervention rather than by inspection recency or administrative priority.
For bridges, the value shifts toward structural health monitoring and load response modeling. Bridge digital twins integrate inspection data, sensor data from embedded monitoring systems, and traffic load records to model how the structure is responding to its operating environment over time. Condition changes that would be invisible in a periodic visual inspection, subtle shifts in deflection response, changes in vibration frequency, micro-crack propagation patterns, become visible in a twin that’s tracking the asset continuously. For aging bridge stock, where the cost of unplanned closure or structural failure is measured in both financial and safety terms, that early warning capability is significant.
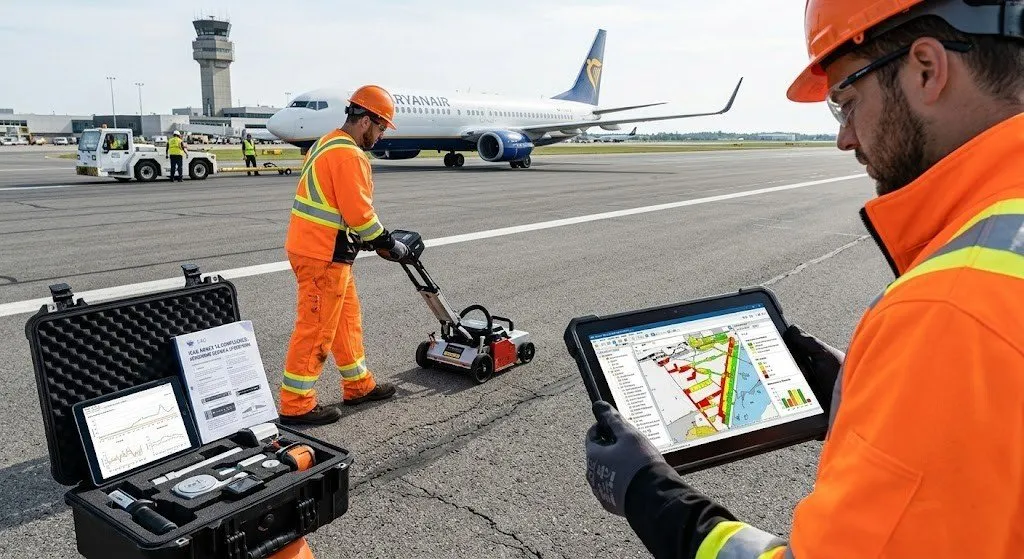
For airports, digital twins are increasingly used to manage the full infrastructure asset portfolio, runway and taxiway pavement, apron surfaces, drainage systems, and airside structures, within a single integrated platform. Runway pavement digital twins fed by drone-based PCI surveys and FOD detection data give airport operators a continuous picture of surface condition across the entire airside, supporting both day-to-day safety management and long-term capital planning.
The data quality problem that determines everything
A digital twin is only as useful as the data feeding it. This is the constraint that most digital twin implementations encounter before the technology’s potential is fully realized, and it’s worth addressing directly because it shapes how inspection programs need to be designed if they’re going to support a twin effectively.
For a digital twin to track condition trajectories rather than just condition states, the inspection data feeding it needs to be consistent across time. The same coordinate system, the same accuracy tolerance, the same defect classification framework, applied to the same asset in the same way on every inspection cycle. Inconsistency in the underlying data, different GPS datums, varying image resolution, different defect severity thresholds applied by different inspectors, produces apparent condition changes in the twin that reflect measurement variation rather than real deterioration. The twin’s predictive model can’t distinguish between a genuine 3-point PCI decline and a 3-point scoring difference between two inspectors working from slightly different criteria.
This is precisely where drone-based inspection, run on a defined, repeatable workflow with consistent positioning, altitude, overlap, and AI-powered defect classification, has a structural advantage over manual inspection for digital twin applications. The consistency of automated data collection is what makes the time-series dataset reliable enough to drive predictive modeling. Without that consistency, the twin accumulates noise rather than signal, and the maintenance decisions it informs are only as good as the underlying measurement reliability.
Where the technology is heading
The digital twin platforms being deployed on infrastructure assets today are increasingly capable of integrating data streams beyond periodic drone surveys. Embedded sensor networks feeding real-time structural health data, connected vehicle data providing continuous pavement roughness measurements across road networks, weather and environmental monitoring linked directly to deterioration models, are all moving from research applications toward operational deployment. The drone inspection survey remains central to the picture, providing the high-resolution spatial condition data that sensor networks and connected vehicle data can’t replicate, but it’s increasingly one input among several rather than the sole data source.
The trajectory points toward infrastructure assets that are monitored continuously, with maintenance interventions triggered by condition thresholds rather than scheduled dates, and capital programs justified by projected condition trajectories rather than reactive response to visible failure. That’s a meaningfully different way of managing infrastructure, and the organizations moving toward it now, building the data infrastructure, the inspection workflows, and the twin platforms that make it possible, are positioning themselves well ahead of the maintenance cost curve.